Quality assurance – lab test reports from PDFs as a table
Test reports and certificates of analysis from contract labs into one table – every parameter with LOQ, result, limit and assessment. With a real example.
By Christian Gerloff · Published August 30, 2026 · Updated August 31, 2026
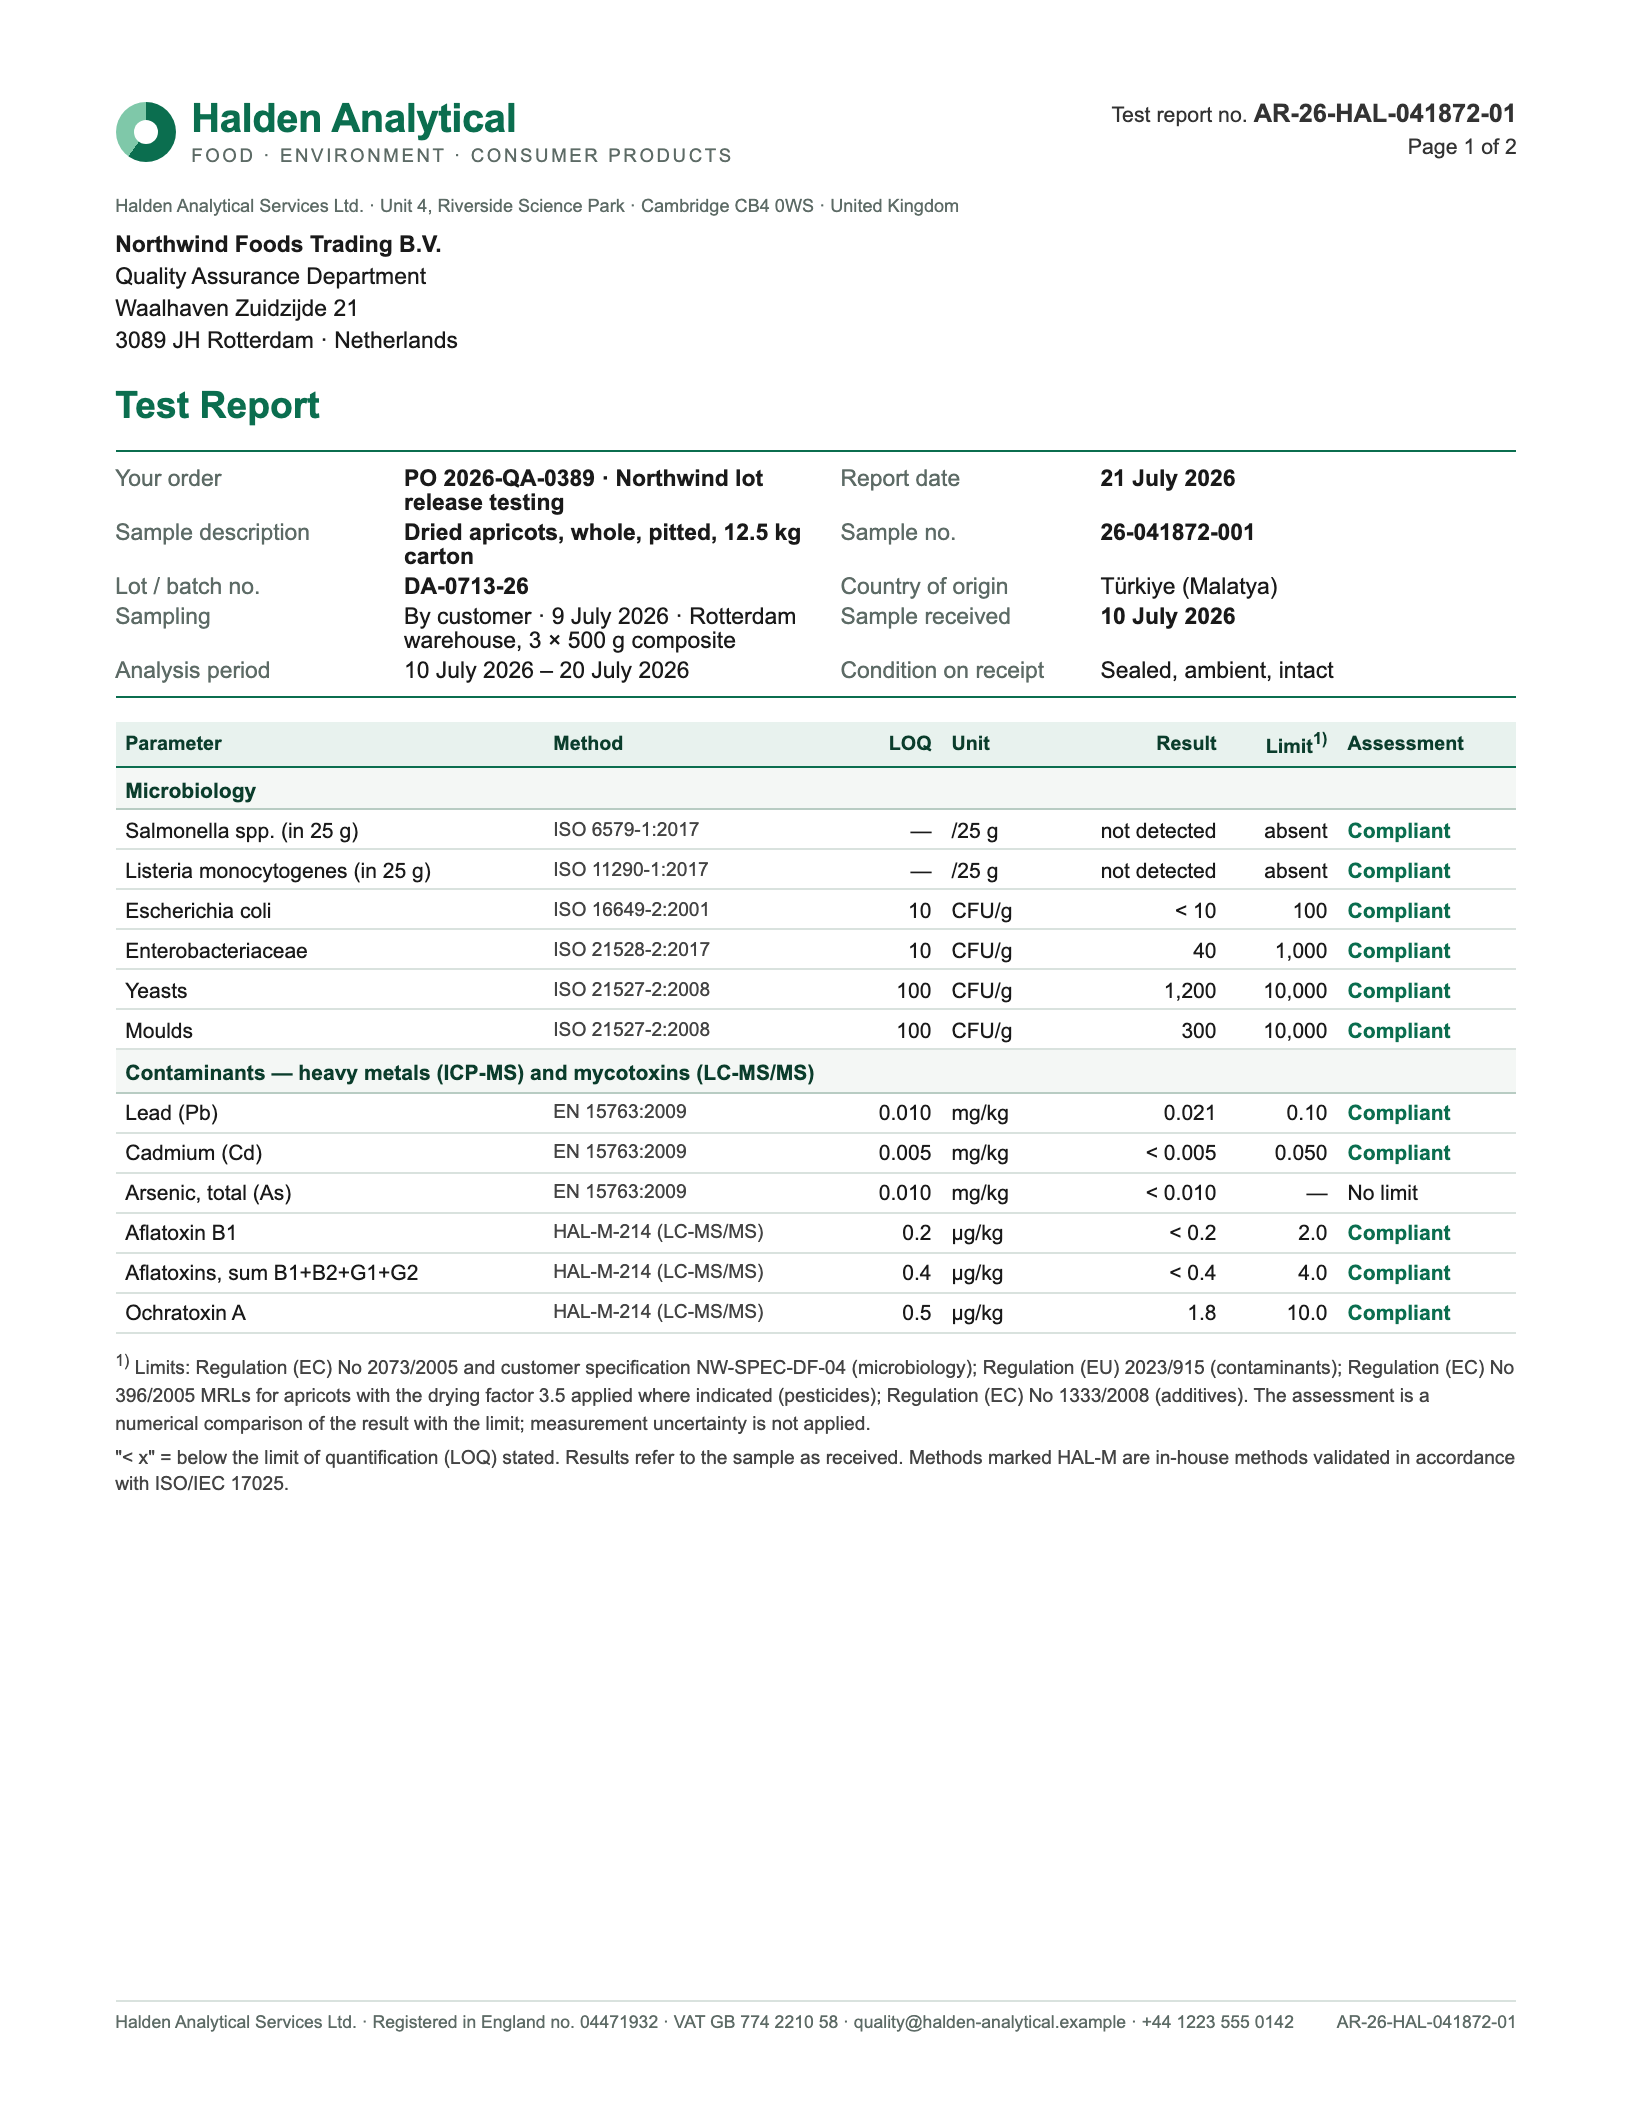
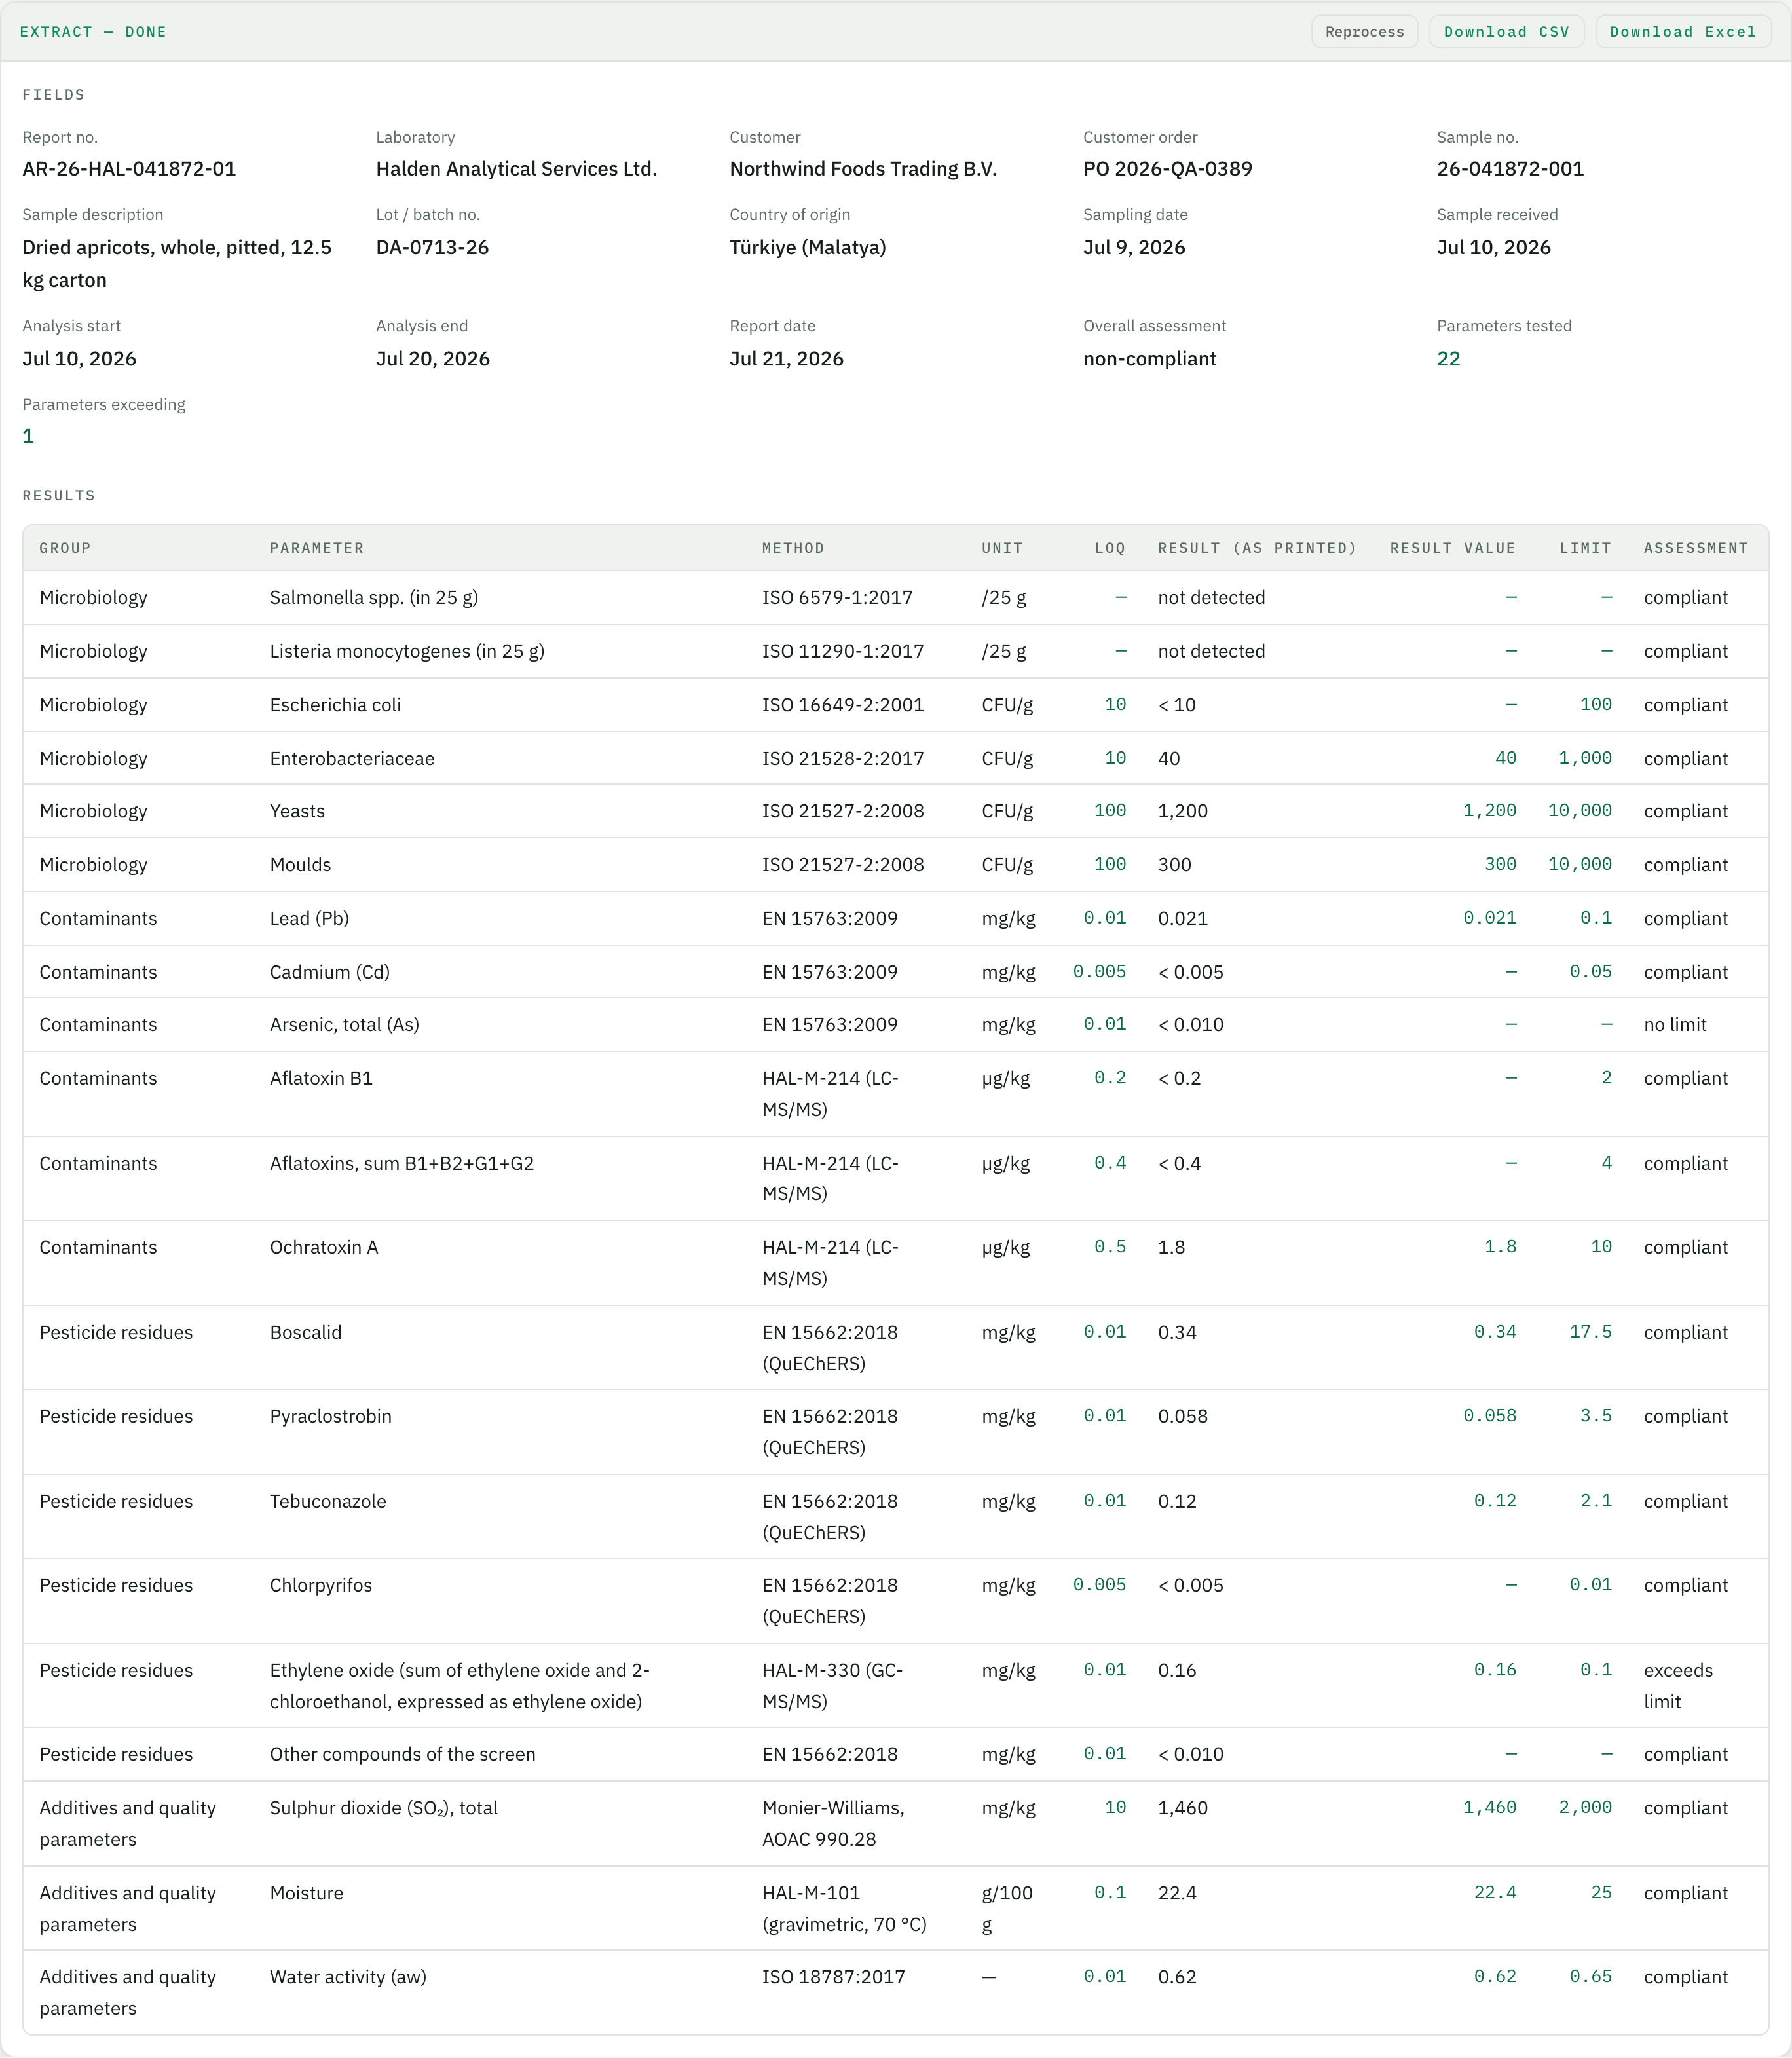
In short: Tiro reads laboratory test reports and certificates of analysis from PDFs and scans and returns them as a table – header fields such as report number, sample, lot and overall assessment once per document, every tested parameter as its own row with method, LOQ, result, limit and assessment. No template, no training – the example is a two-page report with 21 parameters, one of them above its limit.
Below is the complete example: the report, the extracted data and the result in the app.
Who this is built for
Whoever runs the laboratory writes test reports – whoever has many samples tested by contract laboratories receives them. Quality assurance at food importers, brand owners and retailers, at water suppliers and environmental consultancies, at consumer-goods and packaging buyers gets a report for every lot, every sampling point, every product: from Eurofins, SGS, Intertek, AGROLAB or the regional lab, as PDF by e-mail or from a customer portal, each in a different layout. The values then have to be recorded for the lot release, the supplier trend and the audit file – parameter by parameter. That retyping is what disappears.
What else quality teams use it for
Test reports for food and feed (the example below; scanned reports work as shown on the PDFs & scans page): microbiology, contaminants, pesticide residues, mycotoxins, allergens, nutritional analysis – one row per parameter per lot.
Certificates of analysis (CoA) from raw material, ingredient and packaging suppliers: batch, parameter, specification, result – as rows for the batch record. Structure and example on the certificate of analysis (CoA) page.
Mill test certificates 3.1 for steel, castings and pipes: heat analysis and mechanical values per heat – structure and example on the mill test certificate 3.1 (EN 10204) page.
Drinking water and environmental analyses: water, soil, waste and air samples with parameter, LOQ, limit and result – for the sampling-point history and the report to the authority.
Consumer product and textile testing: chemical safety (REACH, formaldehyde, phthalates, azo dyes), physical and flammability tests from the test house.
Calibration certificates and first article inspection reports: instrument, serial number, deviation, next due date – or characteristics, nominal, actual, tolerance.
Why not just a PDF-to-Excel converter?
A PDF-to-Excel converter copies the page layout into cells. For a lab report that means group headings and footnotes between the results, "< 0.005" as text that Excel cannot sum or compare, pages that land in separate sheets, and a different column order for every laboratory. Parseur and Airparser solve this with fields instead of layout, but neither of them shows a laboratory report – their world is invoices and e-mails. Tiro takes the field approach into the quality department with one difference that matters at lot release: numbers and dates are normalised by default, and values below the limit of quantification stay honest – as printed in a text column, empty in the number column, never silently turned into a number. What comes out of Tiro, Excel can compare against your specification right away.
Example: from document to table
A fictional document, one inbox, one run in Tiro — shown unchanged. Company, people and figures are invented.
Header fields once per document, the table as one row per line item — dates as dates, numbers as numbers. The first rows are expanded, the rest follows behind.
Header fields
Field
Value
Report no.
AR-26-HAL-041872-01
Laboratory
Halden Analytical Services Ltd.
Customer
Northwind Foods Trading B.V.
Customer order
PO 2026-QA-0389
Sample no.
26-041872-001
Sample description
Dried apricots, whole, pitted, 12.5 kg carton
Lot / batch no.
DA-0713-26
Country of origin
Türkiye (Malatya)
Sampling date
Jul 9, 2026
Sample received
Jul 10, 2026
Analysis start
Jul 10, 2026
Analysis end
Jul 20, 2026
Report date
Jul 21, 2026
Overall assessment
non-compliant
Parameters tested
22
Parameters exceeding
1
Line items (21)
Group
Parameter
Method
Unit
LOQ
Result (as printed)
Result value
Limit
Assessment
Microbiology
Salmonella spp. (in 25 g)
ISO 6579-1:2017
/25 g
—
not detected
—
—
compliant
Microbiology
Listeria monocytogenes (in 25 g)
ISO 11290-1:2017
/25 g
—
not detected
—
—
compliant
Microbiology
Escherichia coli
ISO 16649-2:2001
CFU/g
10
< 10
—
100
compliant
Microbiology
Enterobacteriaceae
ISO 21528-2:2017
CFU/g
10
40
40
1,000
compliant
Microbiology
Yeasts
ISO 21527-2:2008
CFU/g
100
1,200
1,200
10,000
compliant
Microbiology
Moulds
ISO 21527-2:2008
CFU/g
100
300
300
10,000
compliant
Contaminants
Lead (Pb)
EN 15763:2009
mg/kg
0.01
0.021
0.021
0.1
compliant
Contaminants
Cadmium (Cd)
EN 15763:2009
mg/kg
0.005
< 0.005
—
0.05
compliant
Contaminants
Arsenic, total (As)
EN 15763:2009
mg/kg
0.01
< 0.010
—
—
no limit
Contaminants
Aflatoxin B1
HAL-M-214 (LC-MS/MS)
µg/kg
0.2
< 0.2
—
2
compliant
Contaminants
Aflatoxins, sum B1+B2+G1+G2
HAL-M-214 (LC-MS/MS)
µg/kg
0.4
< 0.4
—
4
compliant
Contaminants
Ochratoxin A
HAL-M-214 (LC-MS/MS)
µg/kg
0.5
1.8
1.8
10
compliant
Pesticide residues
Boscalid
EN 15662:2018 (QuEChERS)
mg/kg
0.01
0.34
0.34
17.5
compliant
Pesticide residues
Pyraclostrobin
EN 15662:2018 (QuEChERS)
mg/kg
0.01
0.058
0.058
3.5
compliant
Pesticide residues
Tebuconazole
EN 15662:2018 (QuEChERS)
mg/kg
0.01
0.12
0.12
2.1
compliant
Pesticide residues
Chlorpyrifos
EN 15662:2018 (QuEChERS)
mg/kg
0.005
< 0.005
—
0.01
compliant
Pesticide residues
Ethylene oxide (sum of ethylene oxide and 2-chloroethanol, expressed as ethylene oxide)
HAL-M-330 (GC-MS/MS)
mg/kg
0.01
0.16
0.16
0.1
exceeds limit
Pesticide residues
Other compounds of the screen
EN 15662:2018
mg/kg
0.01
< 0.010
—
—
compliant
Additives and quality parameters
Sulphur dioxide (SO₂), total
Monier-Williams, AOAC 990.28
mg/kg
10
1,460
1,460
2,000
compliant
Additives and quality parameters
Moisture
HAL-M-101 (gravimetric, 70 °C)
g/100 g
0.1
22.4
22.4
25
compliant
Additives and quality parameters
Water activity (aw)
ISO 18787:2017
—
0.01
0.62
0.62
0.65
compliant
Show all 21 rowsShow fewer rows
3. What it looks like in Tiro
The result in the browser, right after the upload. From here it is one click to Excel or CSV.
How it works
Create a "Lab test reports" inbox
After signing up you give the inbox a name. On the first upload the AI proposes the fields – report number, sample, lot, dates, one table with the parameters. You decide what you need (method, LOQ, limit, assessment) and adjust the names once.
Upload test reports
From any laboratory, in any layout, one or ten pages – every PDF is read on its own. Scanned or e-mailed reports work exactly like digitally signed ones.
Download the table
One row per parameter across all reports, results as real numbers, "< LOQ" kept as printed. Excel or CSV – ready for the lot release, the trend chart per supplier or the import into your LIMS or QM system.
What is in a laboratory test report and who receives many of them?
A test report (also called analysis report, certificate of analysis or CoA) is the laboratory's documentation of what was measured on a sample – per parameter the method, the limit of quantification (LOQ), the result, the unit, the applicable limit and an assessment, plus a compliance statement. Food importers and brand owners, water suppliers, environmental consultants and consumer-goods buyers receive one for every lot, every sampling point or every product – from Eurofins, SGS, Intertek, TÜV, AGROLAB and regional labs alike, each in its own layout.
How does Tiro handle results such as "< 0.005" or "not detected"?
Honestly. The result as printed goes into a text column so nothing is lost, and the numeric value into a number column – which stays empty when the result is below the LOQ or not detected, instead of turning "< 0.005" into 0.005 or 0. In the example above you see both columns side by side.
Does it work when the report has several pages and parameter groups?
Yes – the example is a two-page report with microbiology, contaminants, pesticide residues and additives. Tiro reads all pages as one document, skips the group headings and writes the group name into its own column so you can filter by it later. A two-page report costs two credits.
Can Tiro check the results against my own limits?
Not yet inside Tiro – the laboratory's assessment is extracted as a field, and the numeric result and limit columns make your own check in Excel a formula per row. A rule check directly in the app is planned as part of the review step.
How do I get lab reports into an Excel table?
Upload the report PDF to an inbox – Tiro returns one row per parameter with method, LOQ, result, limit and assessment, as Excel or CSV. Certificates of analysis (CoA) and test reports from other laboratories run into the same table because the fields count, not the layout.
Which other documents does it handle?
Certificates of analysis (CoA) from raw material and packaging suppliers, drinking water analyses, soil and waste analyses, pesticide residue screens, textile and toy safety reports (REACH, formaldehyde, phthalates), calibration certificates, first article inspection reports. Each document type gets its own inbox with its own fields – the principle is always the same: define fields, upload, table.
Where are the documents processed and how long are they kept?
The app runs on servers in Germany, AI processing goes through AWS Bedrock in the EU region Frankfurt, with no training on your data. Retention is set per inbox – down to "delete right after export".
What does it cost?
Getting started is free – 20 pages per month, no credit card. One page is one credit, so the two-page report above costs two credits. Paid plans differ only in the number of pages.